


 8 / 32

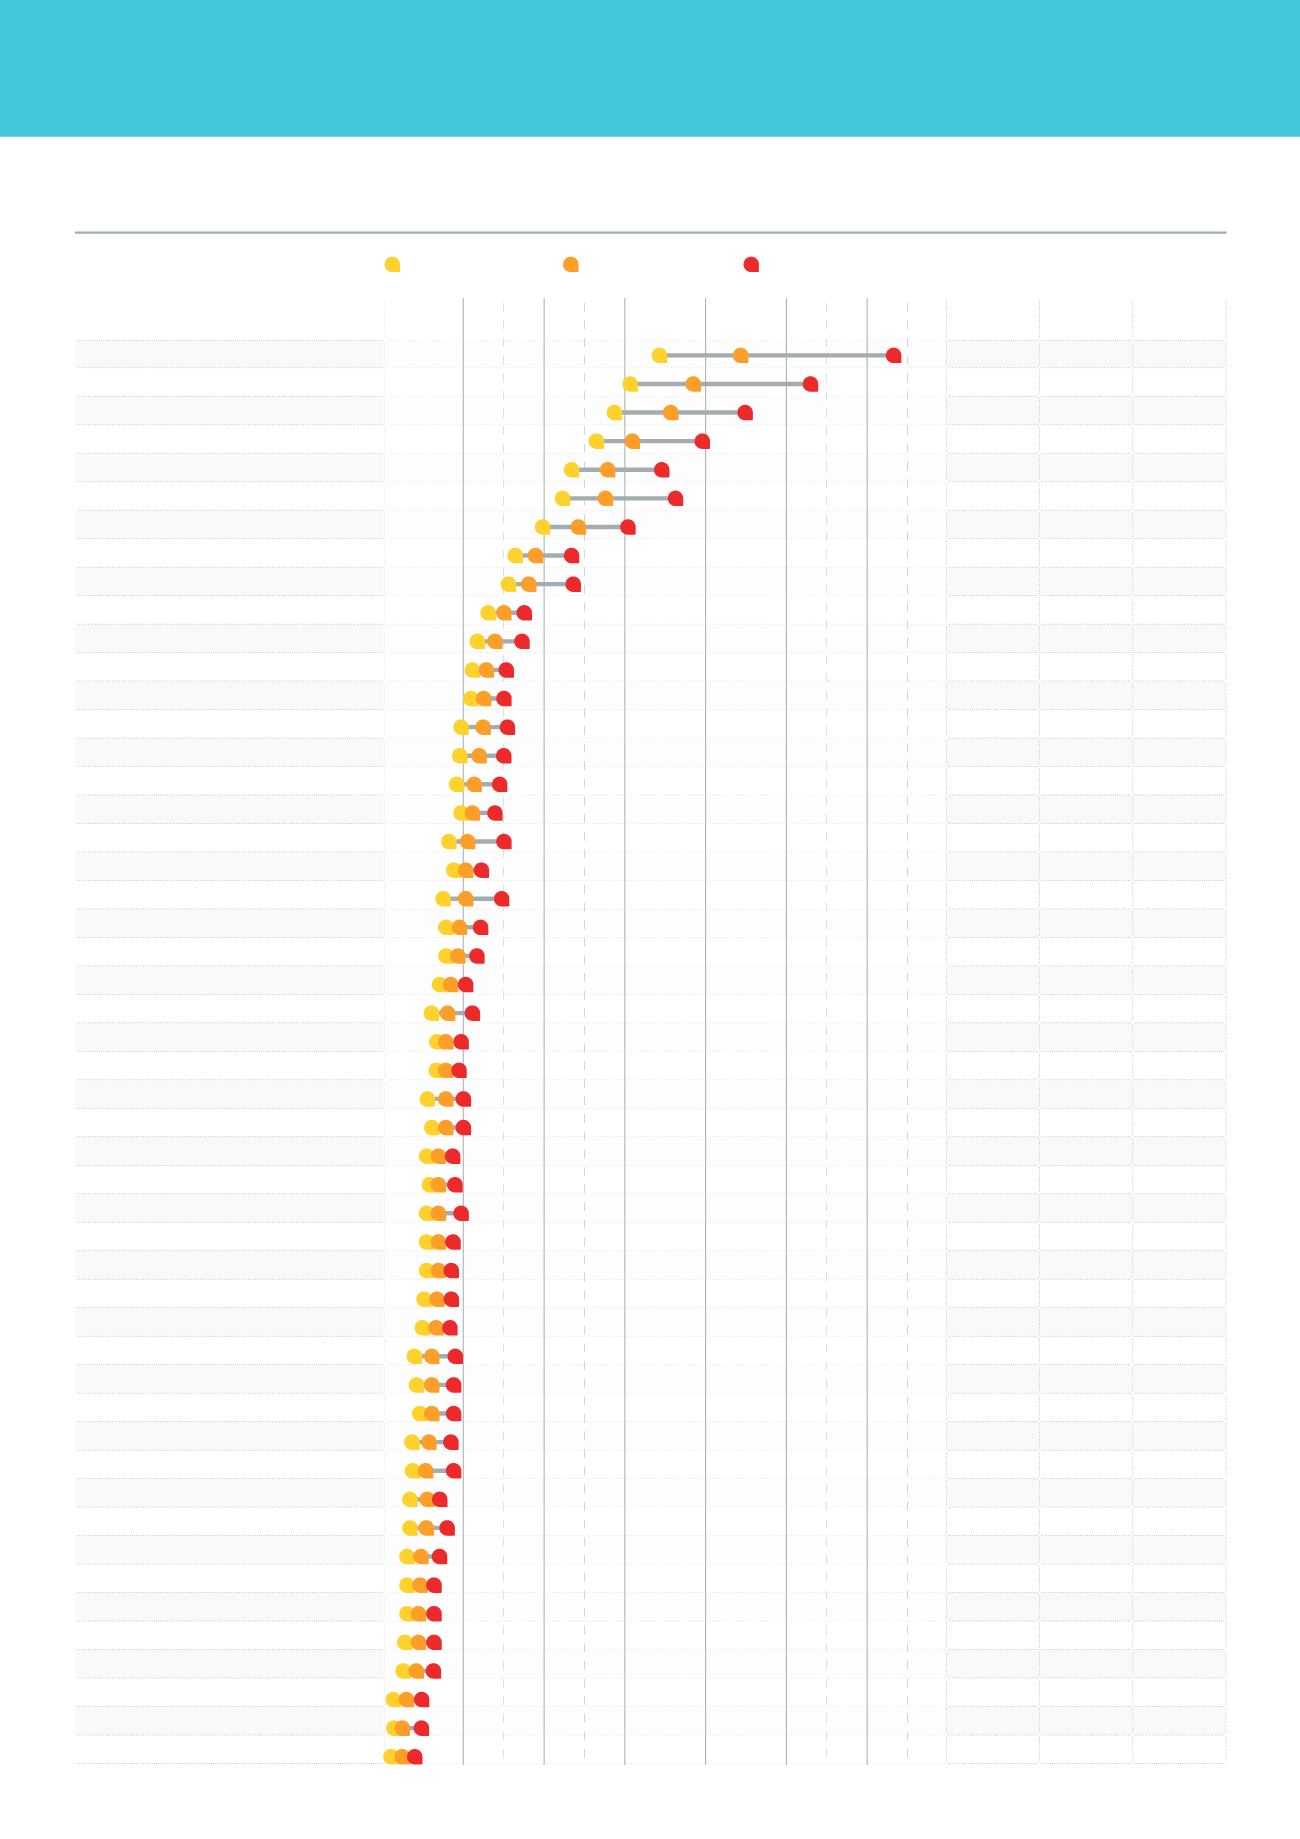
How Sydney and NSW regions compare
Number
sold
Days on
Market
12 month
growth
Eastern Suburbs
2,063
33
14.6%
Lower Northern Sydney
2,685
33
12.9%
Inner Western Sydney
1,385
37
17.5%
Northern Beaches
2,788
29
15.8%
Inner Sydney
2,597
30
15.0%
Central Northern Sydney
5,740
30
13.3%
St George–Sutherland
4,110
32
19.4%
Canterbury–Bankstown
3,223
36
15.2%
Central Western Sydney
3,220
32
14.5%
Fairfield–Liverpool
3,593
35
16.7%
Blacktown
4,211
24
13.4%
Outer South Western Sydney
4,941
20
16.7%
Outer Western Sydney
5,603
23
15.5%
Wollongong
4,018
29
15.4%
Queanbeyan
699
73
2.6%
Central Coast
6,911
25
15.8%
Tweed Heads & Tweed Coast
1,032
59
8.0%
Illawarra SD Bal
3,488
57
13.3%
Port Macquarie
860
35
10.0%
Richmond–Tweed SD Bal
2,523
83
3.1%
Newcastle
10,318
44
5.8%
Coffs Harbour
840
64
6.4%
Lower South Coast
1,710
99
5.1%
Hunter SD Bal
2,036
100
4.6%
Bathurst
745
72
7.0%
Nowra–Bomaderry
818
45
6.6%
Hastings (excl. Port Macquarie)
2,597
71
7.2%
Clarence (excl. Coffs Harbour)
2,220
84
6.3%
Orange
830
80
0.0%
Dubbo
758
50
4.6%
Southern Tablelands (excl. Queanbeyan)
1,662
74
3.0%
Wagga Wagga
1,143
79
5.0%
Lismore
558
79
4.7%
Tamworth
826
79
3.2%
Albury
1,024
69
4.5%
Northern Slopes (excl. Tamworth)
738
102
12.7%
Northern Tablelands
1,239
104
4.5%
Central Tablelands (excl. Bathurst & Orange)
1,176
77
5.1%
Central Macquarie (excl. Dubbo)
878
109
7.7%
Snowy
420
132
–5.5%
Lower Murrumbidgee
643
92
4.2%
North Central Plain
322
138
–3.8%
Central Murray
537
85
–0.7%
Upper Murray (excl. Albury)
400
113
–6.8%
Central Murrumbidgee (excl. Wagga Wagga)
994
93
7.0%
Murray–Darling
177
76
5.0%
Lachlan
1,034
101
0.0%
Upper Darling
103
105
–22.8%
Macquarie–Barwon
222
123
10.2%
Far West
327
117
–1.9%
NEW SOUTH WALES
$0.5m
$1.5m
$1.0m
$2.0m
$2.5m
$3.0m
$3.5m
Lower range (25th percentile) Median price (50th percentile) Upper range (75th percentile)
6