


 10 / 32

Melbourne has recorded the greatest increase in property values of
all capital cities over the past year, up 11.5%. Dwelling values rose
by 3.5% over the second quarter of 2016 to take them 5.8% higher
over the first half of this year. Melbourne’s annual rate of dwelling
value growth remains strong but has slowed from its recent peak in
September 2015 at 14.2%. House values have increased by 12.1%
over the past year, which is double the rate of growth for units (6.1%),
indicating a significant divergence in performance across the two
property types. Melbourne has experienced relatively strong rates of
rental growth over the past year; however, the rate of rental growth has
slowed compared to a year ago. House rents have increased by 1.7%
over the year compared to a 1.4% rise in unit rents. As a result of the
strong value growth, rental yields have softened to record low levels.
Gross rental yields for houses were 3.1% a year ago compared to
2.8% currently. For units, yields are currently recorded at 4.0%, down
from 4.2% a year ago.
VICTORIA
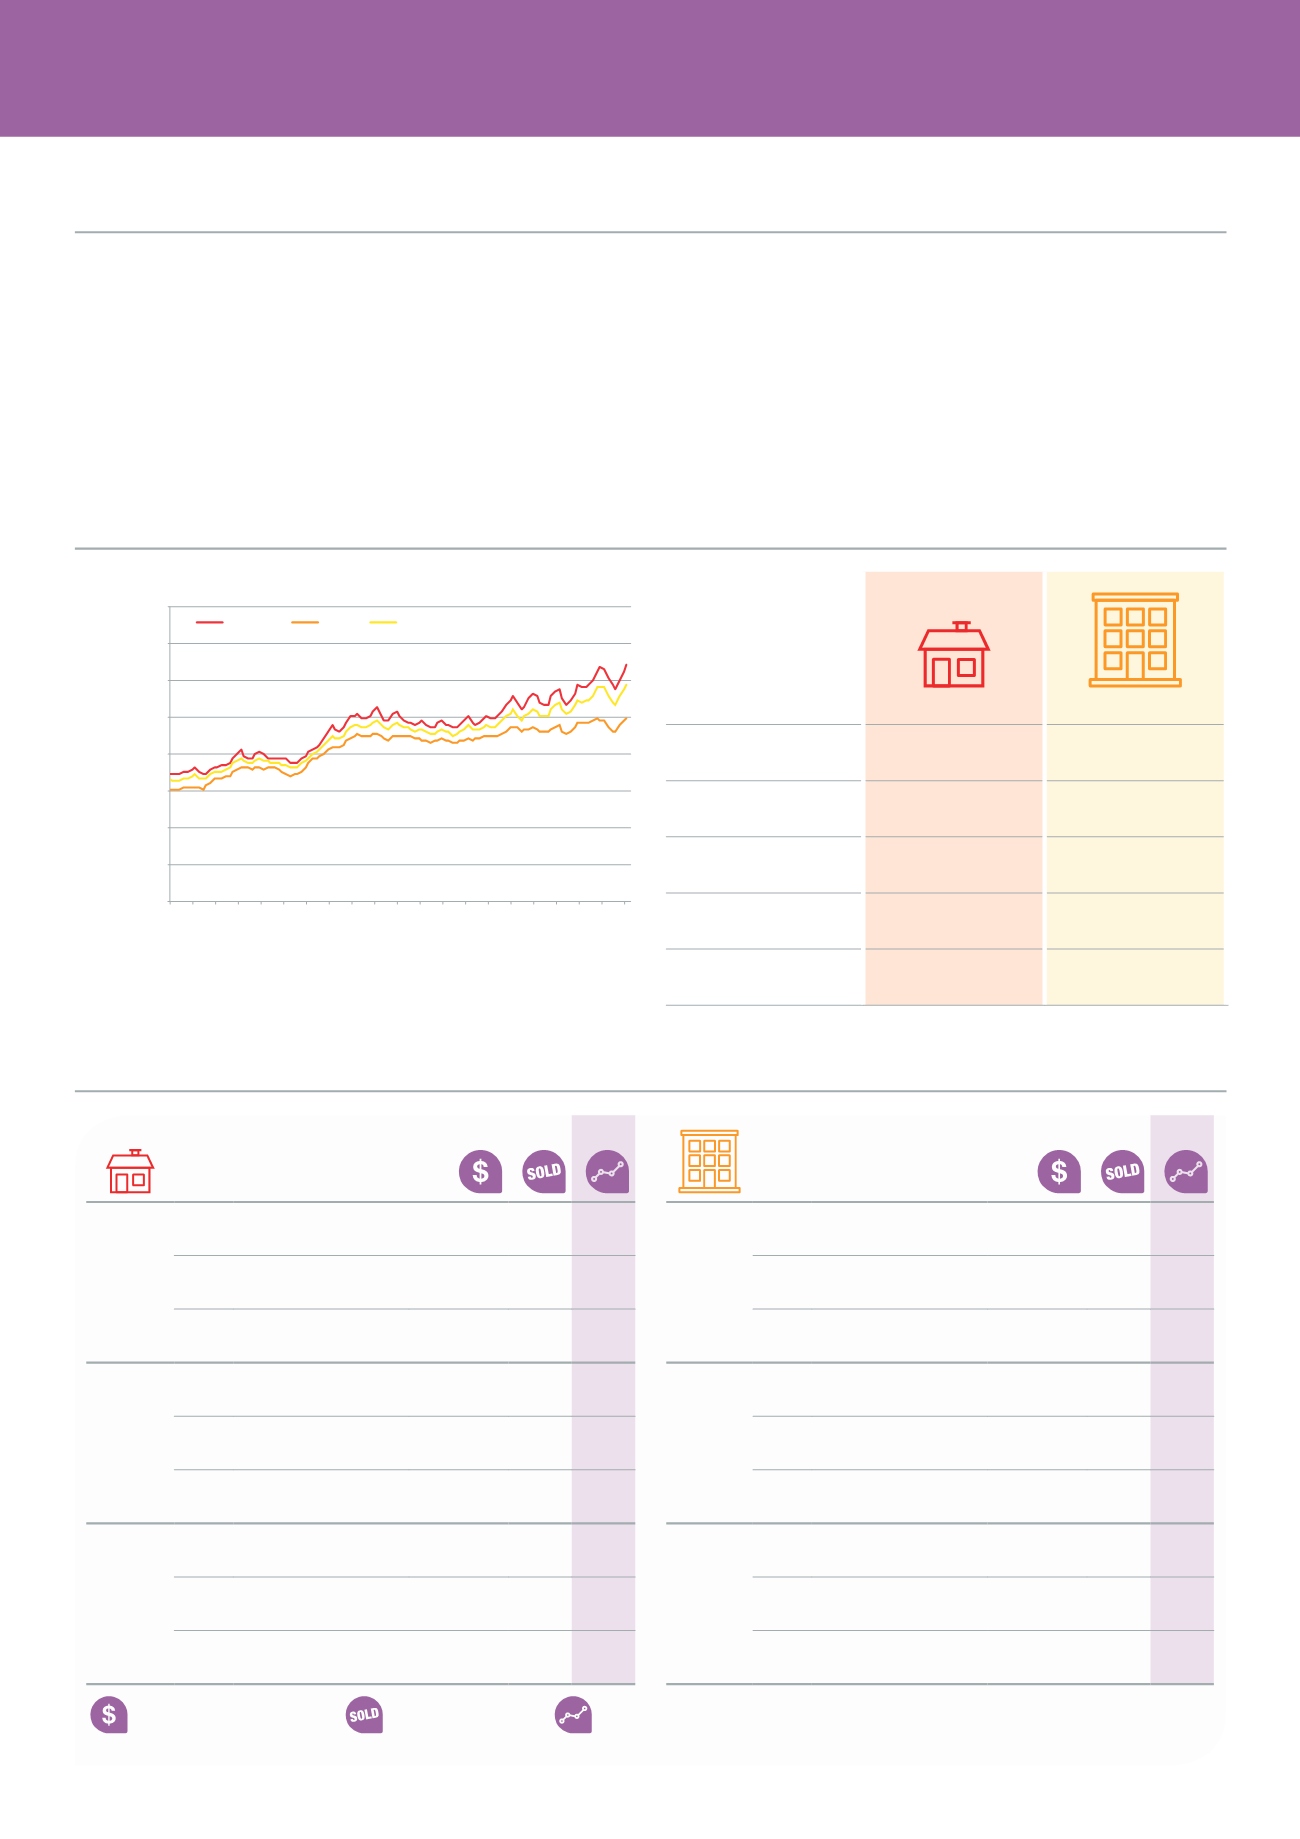
Melbourne shows the strongest capital city growth
Melbourne’s performance over time
Melbourne’s best performers
Houses
Units
Median Price
$640,000
$495,000
Quarterly change
3.8%
1.1%
12 months change
12.1%
6.1%
5 year total change
32.3%
11.7%
10 year total change
103.8%
68.2%
Rank
Suburb
$
Affordable
1
DIGGERS REST
$292,000
57 12.1%
2
FRANKSTON NORTH
$305,000
141 11.7%
3
MELTON SOUTH
$260,000
228 10.6%
$$
Mid–range
1
KEYSBOROUGH
$606,500
335 26.4%
2
HEIDELBERG WEST
$596,000
85 26.3%
3
BELGRAVE HEIGHTS
$600,000
16 21.7%
$$$
Prestige
1
DEEPDENE
$2,735,000
28 24.3%
2
ARMADALE
$2,175,000
81 24.3%
3
CAULFIELD NORTH $1,867,500
110 23.3%
Rank
Suburb
$
Affordable
1
ALBION
$251,500
55 20.5%
2
PAKENHAM
$287,250
120 9.8%
3
WYNDHAM VALE
$280,000
22 9.8%
$$
Mid–range
1
MOOROOLBARK
$478,000
74 24.2%
2
CROYDON NORTH
$490,000
45 18.5%
3
SEDDON
$483,000
39 16.4%
$$$
Prestige
1
BEAUMARIS
$1,000,000
74 22.9%
2
CANTERBURY
$986,000
51 14.5%
3
BRIGHTON EAST
$905,500
91 13.0%
Rolling Median Price (12 months)
Number sold (12 months)
12 month change in median price
Affordable
= suburbs below 25th percentile
Mid–range
= suburbs between 25th and 75th percentile
Prestige
= suburbs above 75th percentile
Melbourne Median Price
Houses
Units
Dwellings
$0
$100,000
$200,000
$300,000
$400,000
$500,000
$600,000
$700,000
$800,000
JUN-06
DEC-06
JUN-07
DEC-07
JUN-08
DEC-08
JUN-09
DEC-09
JUN-10
DEC-10
JUN-11
DEC-11
JUN-12
DEC-12
JUN-13
DEC-13
JUN-14
DEC-14
JUN-15
DEC-15
JUN-16
Based on CoreLogic monthly indices capital city data to June 30, 2016
8